
When it comes to evaluating the macro-level success of a paid search campaign, sometimes you have to go small — micro, to be specific.
In the early days of the COVID-19 pandemic, we preemptively took a look at one client’s micro conversion data in order to implement recommendations for making their revenue goals a reality. Spoiler: We saw less ad spend, more pages per session, a much higher conversion rate, and more.
We share our discovery process with you here — just in case you want to do your own micro conversion digging, too.
The Backstory
After the pandemic hit in March and stay-at-home orders were put in effect, Inflow quickly realized the impact it would have on businesses, especially small local businesses.
With that in mind, we decided to initiate a Pay-It-Forward program, in which we offered free services to a few of our small business clients. One of the lucky winners in this program currently had a contract for Search Engine Optimization services and was offered three free months of Paid Advertising services.
A little bit about the client: They sell house plans and blueprints online, so they’re a bit of a mixture between eCommerce and lead generation. Prior to onboarding with Inflow, they ran paid search campaigns in-house and, quite frankly, we were impressed with their account to begin with!
With that, we had to quickly come up with strategies to improve the account even more — and hopefully onboard them as a full-time PPC client.
The First Step: Communicating Overall Goals
Knowing we had three months to prove our skills, aligning on expectations and goals was crucial.
Prior to making any changes within the account, we asked the client what their specific goals for paid advertising were. We quickly learned that generating transactions was not their sole and only objective.
They deemed the following micro conversions highly valuable in the customer journey path:
- Account Sign-Ups
- Modifying House Plans
- Ask a Question
Luckily, these goals were already set up in Google Analytics and imported into Google Ads. On top of that, the client had CRM data on all inquiries involving the above goals.
We said, “Send us all the data you have!”
Assessing Micro Conversions Value
After receiving several months of CRM micro conversion data, we had the numbers do the talkin’. Here’s what we worked with:
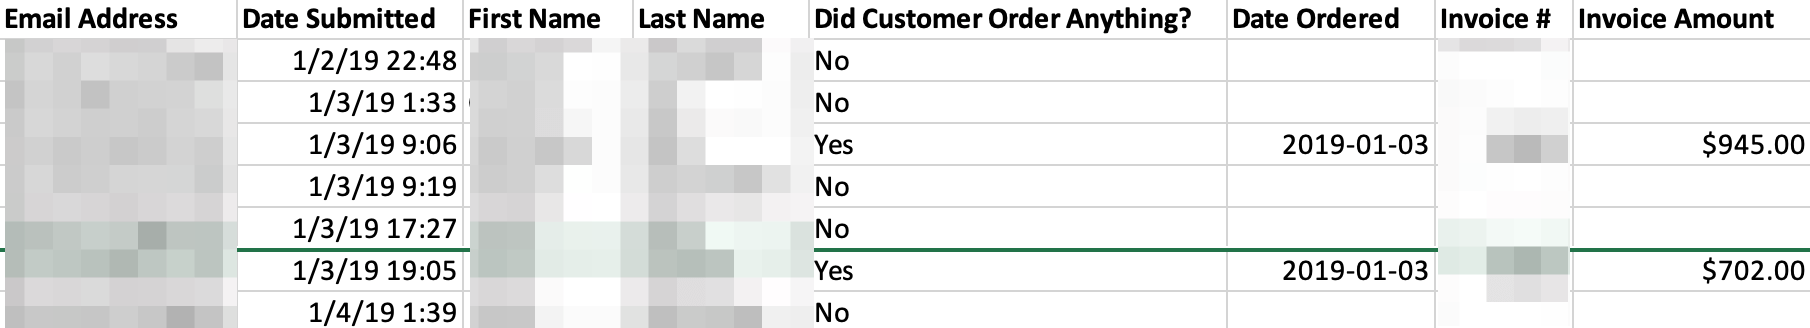
1. A spreadsheet with separate tabs for the micro conversions “Account Sign Ups,” “Modifying House Plans,” and “Ask a Question.”
The setup was the same across all three tabs, with the following columns tracking the micro conversions and their values:

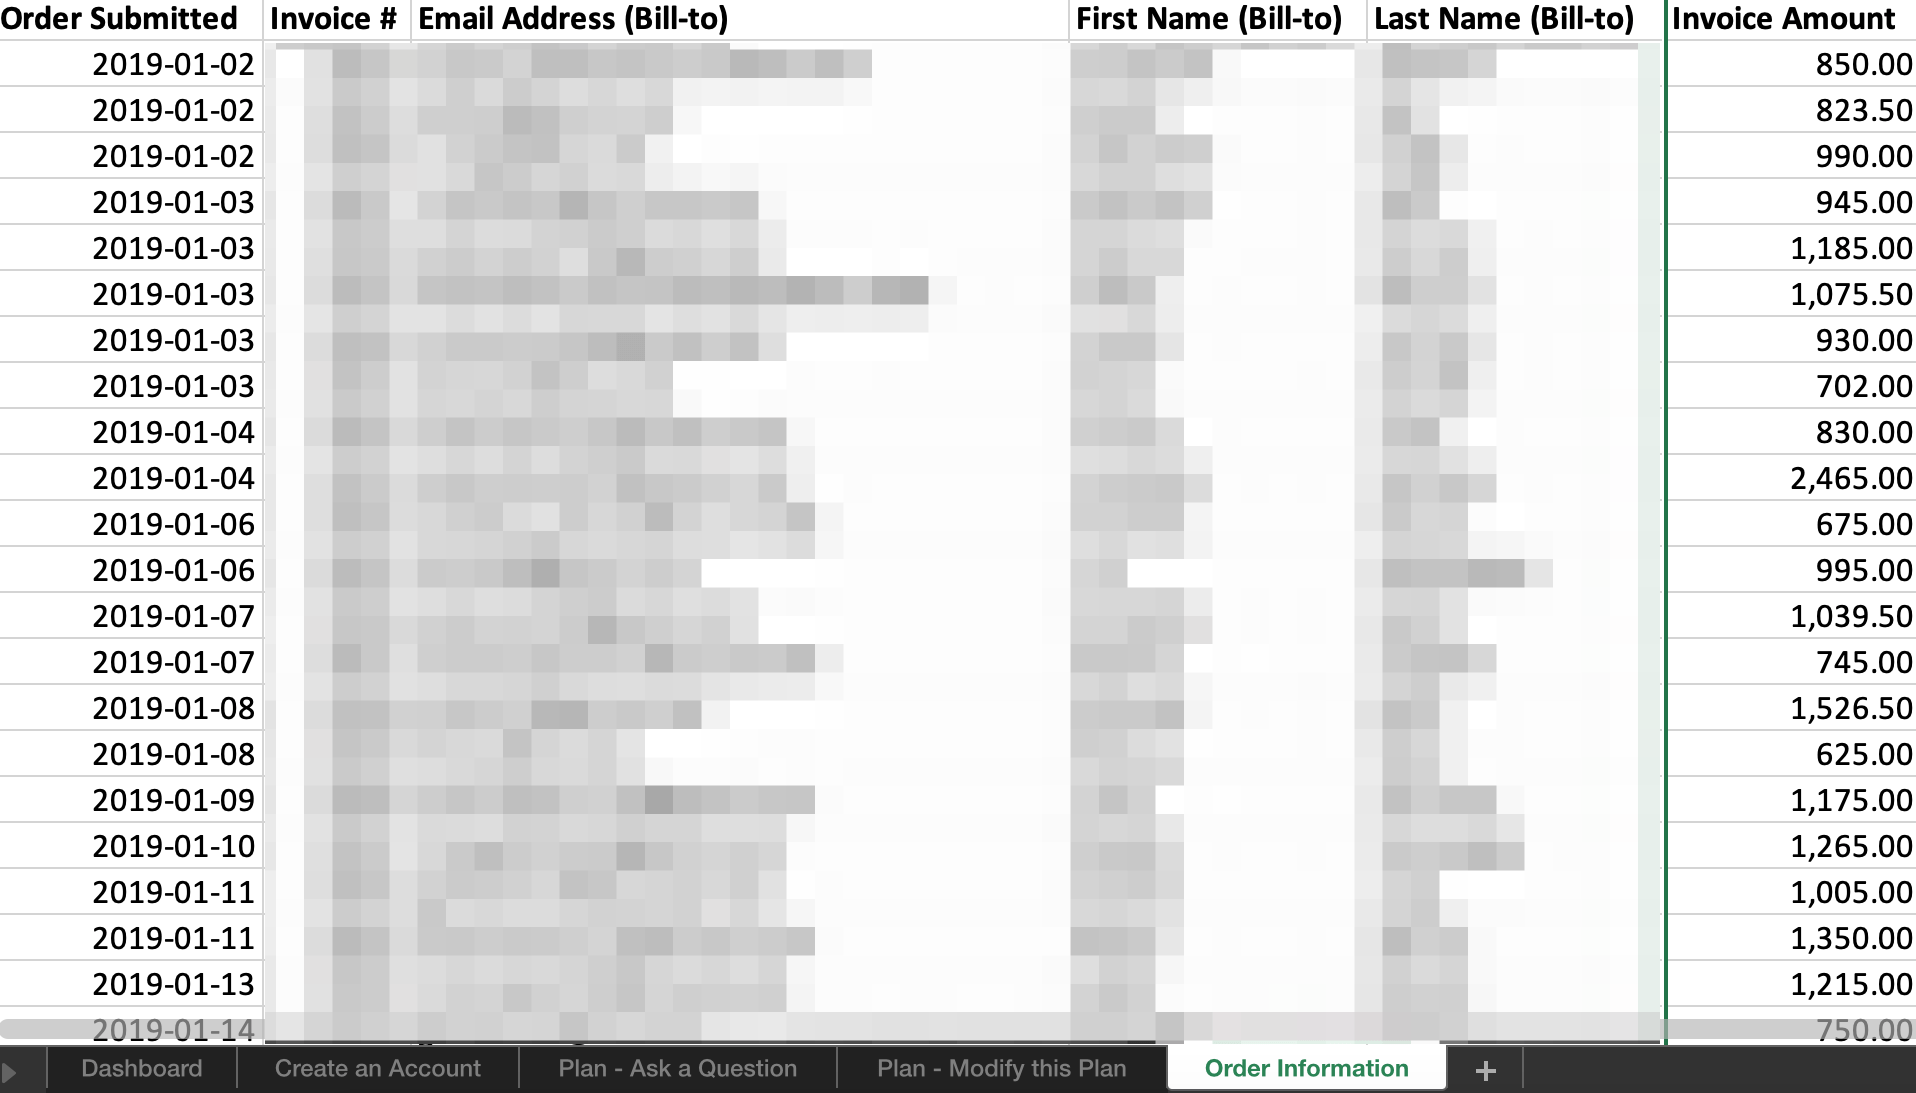
2. An “Order Data” spreadsheet listing all transactions within the same time period.
The columns included:

3. Our brains!
Our goal was to associate micro conversions with transactions. From there, we could assign several values to each micro conversion, and then we’d be able to optimize based on the data.
Based on the email addresses associated with the goal completion and orders, we assessed customer behavior. For each goal completion tab, we created formulas to pull in “Date Ordered,” “Transaction Path Duration,” “Revenue” and “Conversion Rate,” depending on who ordered the product or not.

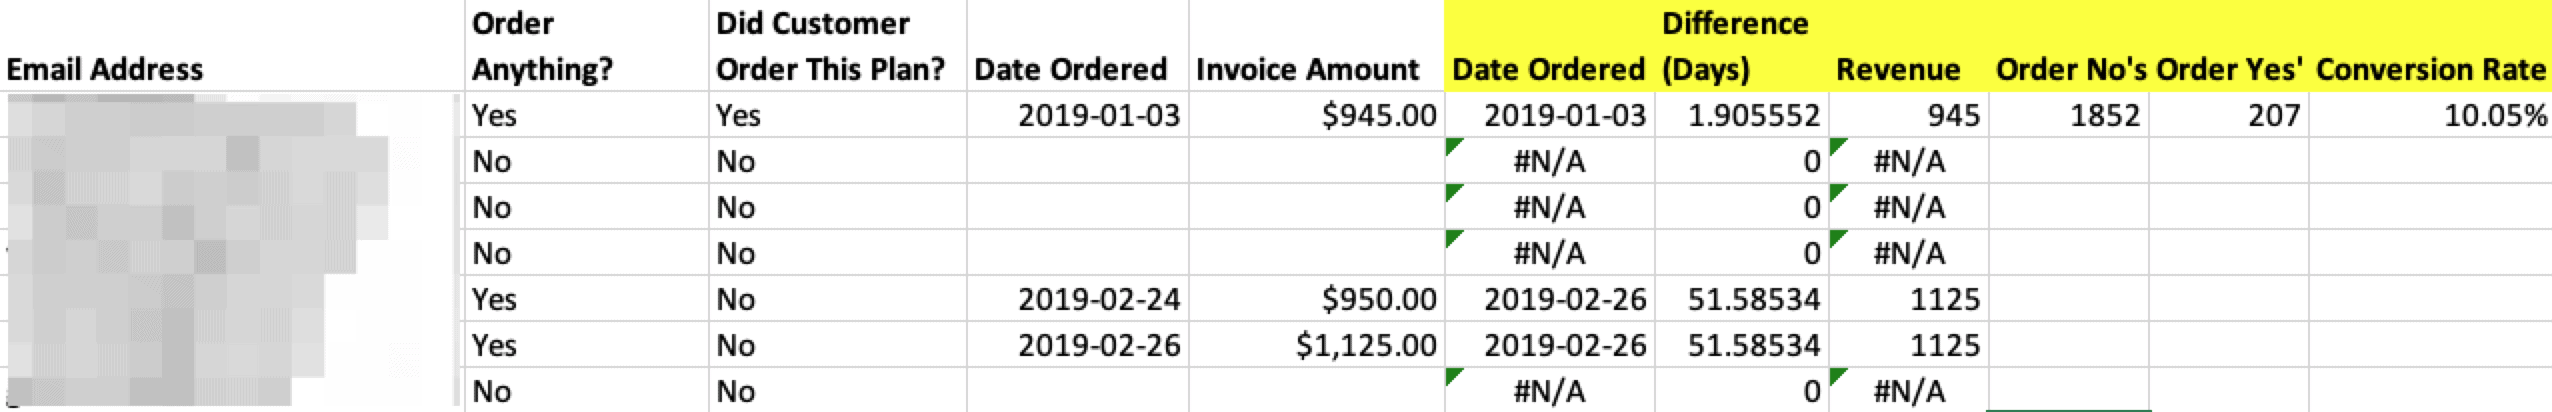
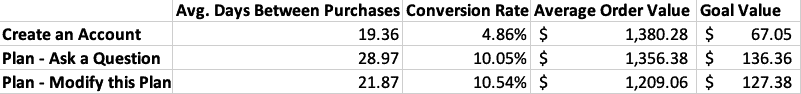
Pulling that data for each goal completion allowed us to gather average time between purchase, conversion rate, average order value and “goal value” to import back into the accounts. Using that, we could gauge potential revenue.

Initial Optimization Efforts: Some Easy Wins
Based on the values we assigned to each micro conversion, we were able to more accurately make adjustments within the account to scale back spending in inefficient areas while capitalizing in areas with higher intent.
Specifically, we focused most of our initial efforts on:
- Keyword Optimization: We segmented keyword data by conversion action and made adjustments based on micro conversion values and possible potential revenue. Once we had enough data, we cut keywords that had spent a lot and didn’t provide the results we wanted.
- Ad Group Optimization: In a broader sense, analyzing ad groups on micro conversion data helped us better analyze how specific ad groups were performing.
- Search Query Analysis: Micro conversion performance in Google Analytics shed light on possible long-tailed keywords that we ended up adding, which created overall higher intent ad groups.
Location! Location! Location!
This particular client originally segmented their campaigns with geography and location data. Prior to our work within the account, we could see that each campaign was clearly segmented by regions of the United States.
Our goal here was to analyze the targeted locations based on micro conversion performance and scale back in inefficient areas. How we did it:
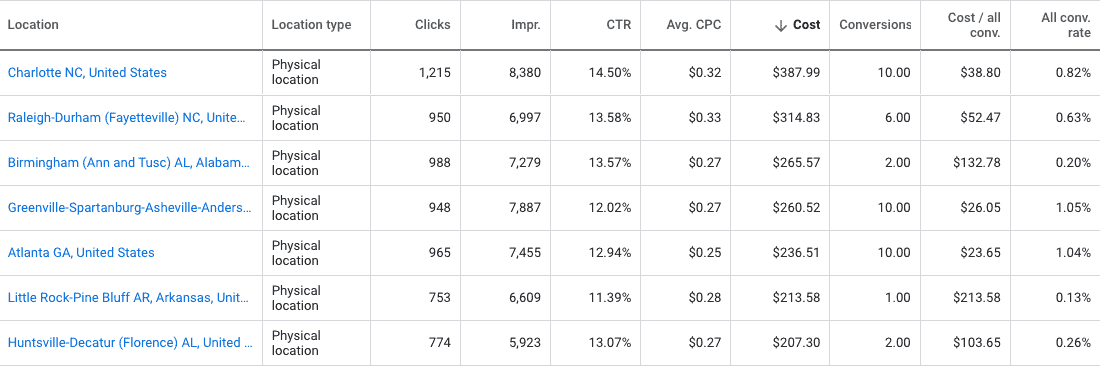
We pulled several months of data — performance segmented by city, state, and metropolitan areas — from Google Ads and Google Analytics. From Google Ads, we were able to gather conversions, impressions, clicks, impression share, and average cost-per-click.
State Data

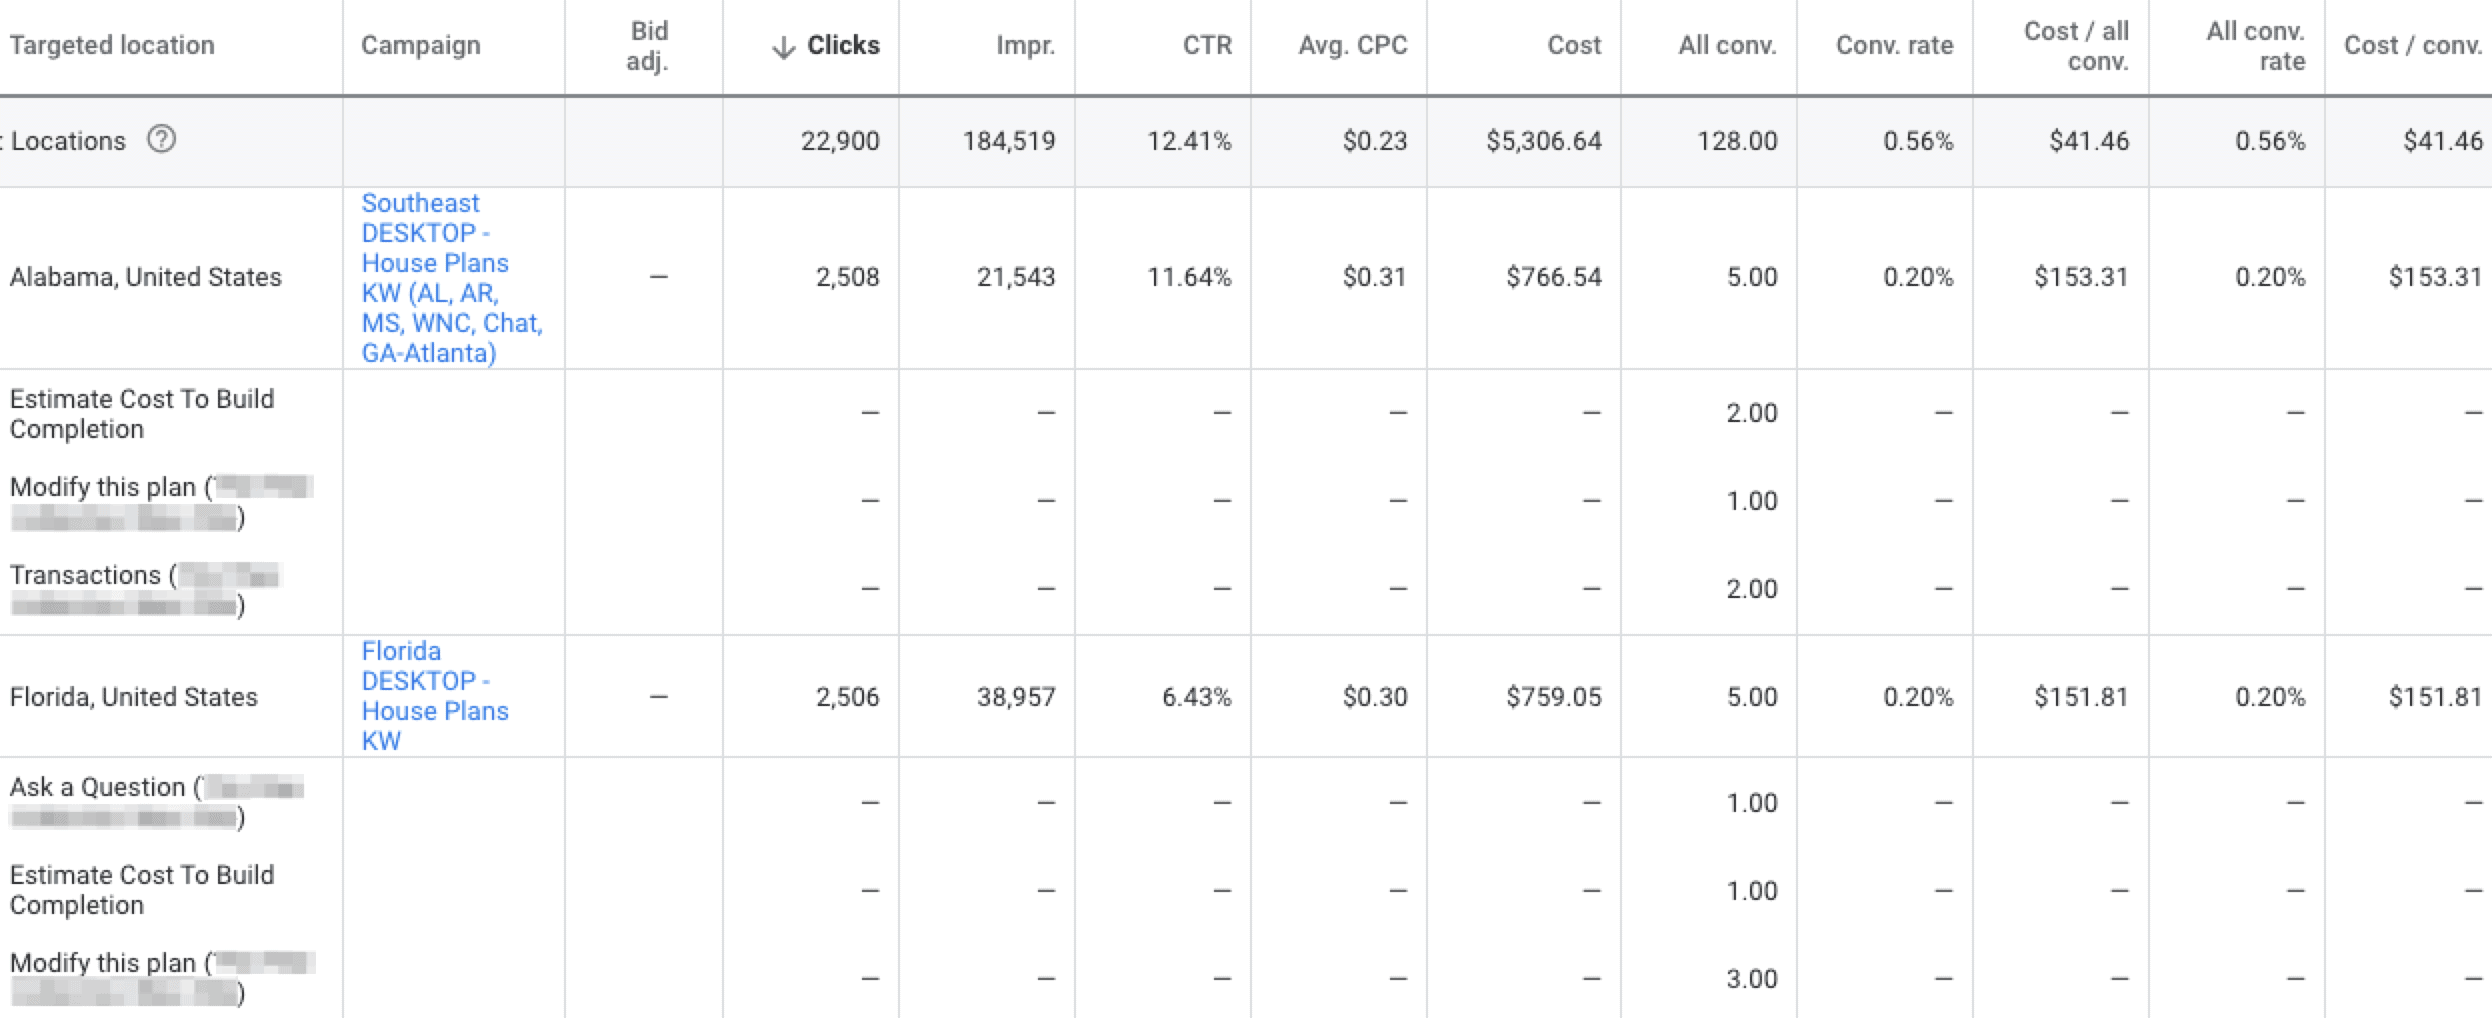
City/Metro Data

We then collected transactions, revenue, and eCommerce conversion rate from Google Analytics.

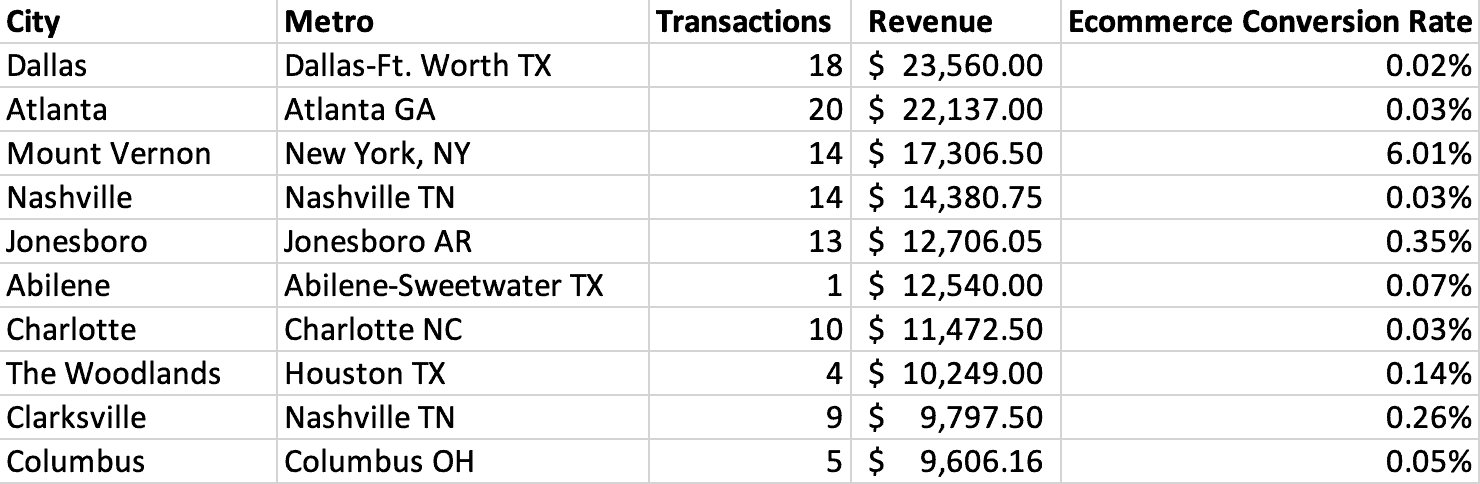
We were able to see exactly which locations to cut and which to keep, based on micro conversions, spend, conversion rate, transaction volume, and revenue, of course.
After making cuts in specific locations across all campaigns in June of 2020, we gathered data for three months and compared what we were seeing to the previous period. The results? Less ad spend, more pages per session, a much higher conversion rate, and slightly more micro conversions:
- Cost decreased 6.57%.
- Pages per session increased 5.93%.
- Conversion rate increased 37.32%.
- Micro conversions slightly increased by 0.24%.


The Next Step: Utilizing the Data for Remarketing Campaigns
Here at Inflow, we’re always looking to the next step. In this case, it was using the data we’d analyzed to plan the remarketing campaigns.
We sat down to brainstorm: How we could turn the existing campaigns around? What kind of audiences could we target that possibly had higher intent and would lead to better results?
We came up with a few solutions:
- An audience based on the micro conversion users, ie. those who had signed up for an account or asked a question on the site
- An audience who “saves for later”: Our client’s website allows users to click a “favorite” button on the house plans they want to save for later. Another audience created, thanks to that event being already set up in Google Analytics.
- Extended abandoned cart audience: The current remarketing campaigns had audiences for abandoned cart within the last 30 days, so we created an audience for the same event, except extended to within the last 90 days. Micro conversion analysis pays off once again!
We ended up pausing all other remarketing campaigns and started fresh with the new audiences we created in three separate ad groups. The results are still pending on this new campaign, so stay tuned for an update.
Still, the client saw the potential — and was excited about — the new targeting method:
“We’ve been impressed with the knowledge, strategic changes, and analytics you’ve brought to our PPC account in this short time. We are excited to continue to work with you and look forward to growing this part of the business together.”
A Win-Win Conclusion
After three months of collecting and optimizing the data within the account, the client expressed their gratitude for our services. They decided to onboard as a full-time Paid Advertising client. We’re excited to dive deeper into their accounts and campaigns and to see what even greater results await them.
Cheers to micro conversion data!
Curious to see what micro conversion data could mean for your business? Request a free proposal from an Inflow PPC strategist today.


